 |
|
Using advanced
programming techniques, Dataputer's Datastat CS (Client Server Version)
is a powerful SPC software program, which gives professional results
in an easy-to-use package. Using Client / Server technology with
open database connectivity (ODBC), Datastat CS can be linked to
existing data and allows multiple Users to share a common database.
Datastat CSV
is available in two versions, Administrator and Shopfloor.
| Administrator |
In
this version all the set-ups are created for SPC studies including
gauge configurations, tests for control, identification tags,
user logins, security privileges, report designs and screen
customisation. |
| Shopfloor
|
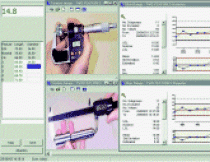
Provides
the User with all the tools necessary to control the manufacturing
process. Data collection can be by keyboard, direct gauge entry
multiplexer, or by touch screen technology. Charts can be displayed
alongside the readings and updated "live" as new data
is collected. Warnings are given if violations occur and Cause
/ Actions and notes can be entered to record the problem and
its solutions. |
|
|
CONTROL
CHARTS
|
|
|
Variable Charts
Xbar/Range, X/bar Sigma, Individual
and Moving Range, Capability Indices, Warnings for out of control
situations (“traffic light” sigma zoning), Cause and Actions,
Run Chart, Scatter Chart to examine correlation between variables,
Cp/Cpk Evolution of continuous improvement.
|
|
Attributes Chart
p, np, c, u Defect Pareto
|
|
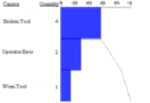
Cause / Action Pareto Charts
Identifies which is your most frequent
reason for production faults and how you are correcting them.
|
|
CAPABILITY
STUDIES
|

|
|
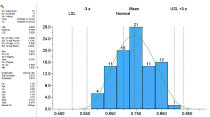
Histogram of Individuals, Subgroup
Means, and Johnson (non-normal distribution) Curve Charts
|
|
Distribution analysis – skewness,
kurtosis, Chi-square curve fit test
|
|
Capability Statistics – Pp, Ppk,
Cp, Cpk, CAM (CNOMO), etc
|
|
Multi-variable Capability Overview
Chart
|
|
DATASTAT
CS ADMINISTRATOR ADDITIONAL FEATURES
|
|
SET-UPS
|

|
|
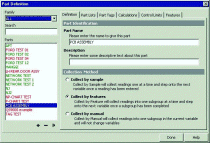
Part Definitions
Detailed
information about the process such as tolerances, method of data
capture, which violations are tested for etc, are entered.
|
|
Pre-defined lists
Known as
Pick Lists can be created for Tag Entries, Warnings, Cause / Actions
and Defects. These avoid
the need to type in this information and hence reduce errors.
|
|
Calculation modes
User selected
to determine when and how Control Limits etc, are calculated.
|
|
Gauge set-ups
Specify
which gauges are used for each measurement and to configure the
gauge for automatic data entry.
|
|
Choice of languages - English or French
|
|
|
Customisable Warning Lists
Create
your own warning lists, or use the standard lists in the software.
|
|
Chart Customisation
Set up
individual configurations, colours, orientation, zoom, layout,
etc.
|
|
Screen layouts
Set up
your views to suit the way you want to work. These can be created
and set up for each part and they appear automatically when the
User logs on.
|
|
SECURITY
|
- Advanced
security features that help Users achieve compliance to FDA's
21 CFR Part 11 regulations. These include:
- Encryption
of passwords.
- Audit trail
of data addition, deletion and edits
- Log of
all access and administrator warning of security breaches.
- Password
expiry.
- Restricted
access based on user profiles
|
REPORTING
- All printed reports
are fully customisable. If you don't like the reports supplied with
the package these can be easily changed or new reports can be designed
in minutes with our visual Report Designer.
- Reports can be
output in PDF format for e-mail purposes.
- Screen layouts
can be printed out with one mouse click.
- Print preview
of any report - see exactly what will appear before printing.
- Batch Reports
can be set up to print multiple reports unattended.
OTHER FEATURES INCLUDE
- Control Charts
retain historical limits each time control limits are recalculated
so that you can see how your process is performing.
- Fully networkable
as standard - view at one station data being collected at any of the
other stations. All charts are updated "live" at all stations,
not just the one that is entering data.
- Customisable
tool bars - short cut icons speed access to data and charts, only
requiring a single mouse click.
-
Works
in conjunction with the full range of Dataputer Gauge Multiplexers
for direct entry of measurements.
|


