Statistical
Process Control (SPC) Software
Controlling
The Process
For
a product to be made without scrap, it must be manufactured within specified
limits. But factors can prevent this from happening:
Natural
Variation: inherent in the machining process and cannot be changed
without using a different process or machine
|
Assignable
Variation: outside influences that are controllable: temperature,
sharpness of the blade, speed of manufacturing, skill of machinist
etc.Costly re-work is not always possible
|
An
Example of Variation - A machine cutting straws to length will give
an error from straw-to-straw. This is because of the inherent tolerances
of the machine - Natural Variation. This is less significant than someone
who cuts the same straws to length, using a ruler - Assignable Variation.
This
raises the question - Is the manufacturing process able to manufacture
within specification?
Testing
The Process Capability
Continuing
our example, cut a number of straws to the required length (usually
50). Accurately measure the straw lengths. Plot the lengths on a graph
to identify the variation.
Histogram
and Capability charts can be used for this purpose. Once it has been
determined that the process is capable, the process can be monitored
over time.
Monitoring
The Process Over Time
In
an ideal world, every product that is being made would be measured.
In the real world, there is not enough time or resource to do this so
a sample group of product is measured on a regular basis. These groups
are known as subgroups.
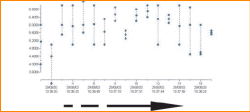
The
subgroups of data are plotted on to a graph - in chronological order:
 |
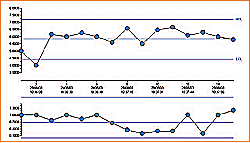
The
average value of each subgroup is then used to generate the Process
Control Chart - building up the actual manufacturing process over
time, known as an Xbar Chart. |
|
Setting
Control Limits
In order
to prevent scrap, a set of “early warning limits” known as Control
Limits are established. These limits are set inside the upper
and lower specification limits and warn the operator before scrap
is produced.
|
 |
 back
back
www.elcometer.com


